



Financial performance and renewable energy adoption
When renewable energy costs become competitive with or lower than traditional fossil fuel alternatives, transitioning to renewables can directly lead to cost savings and therefore enhance corporate profitability. However, a critical consideration for investors is whether companies adopting renewable energy realize measurable improvements in financial performance, and whether these improvements are reflected in stock valuations.
To investigate this, we analyzed companies within the Bloomberg World Large & Mid Cap Index (Bloomberg ticker: “WORLD Index”), a broadly diversified, float market-cap-weighted global equity benchmark index representing approximately 85% of global market capitalization of the measured markets. In aggregate, Bloomberg’s sustainable finance data covers about 97% of the index’s constituents and 99% of its market value as of December 2024. In particular, the analysis employs the Bloomberg field “Percentage of Renewable Energy Consumed” (Field Id: SA011) as the primary determining factor. Companies lacking data on renewable energy consumption were excluded to maintain analysis integrity.
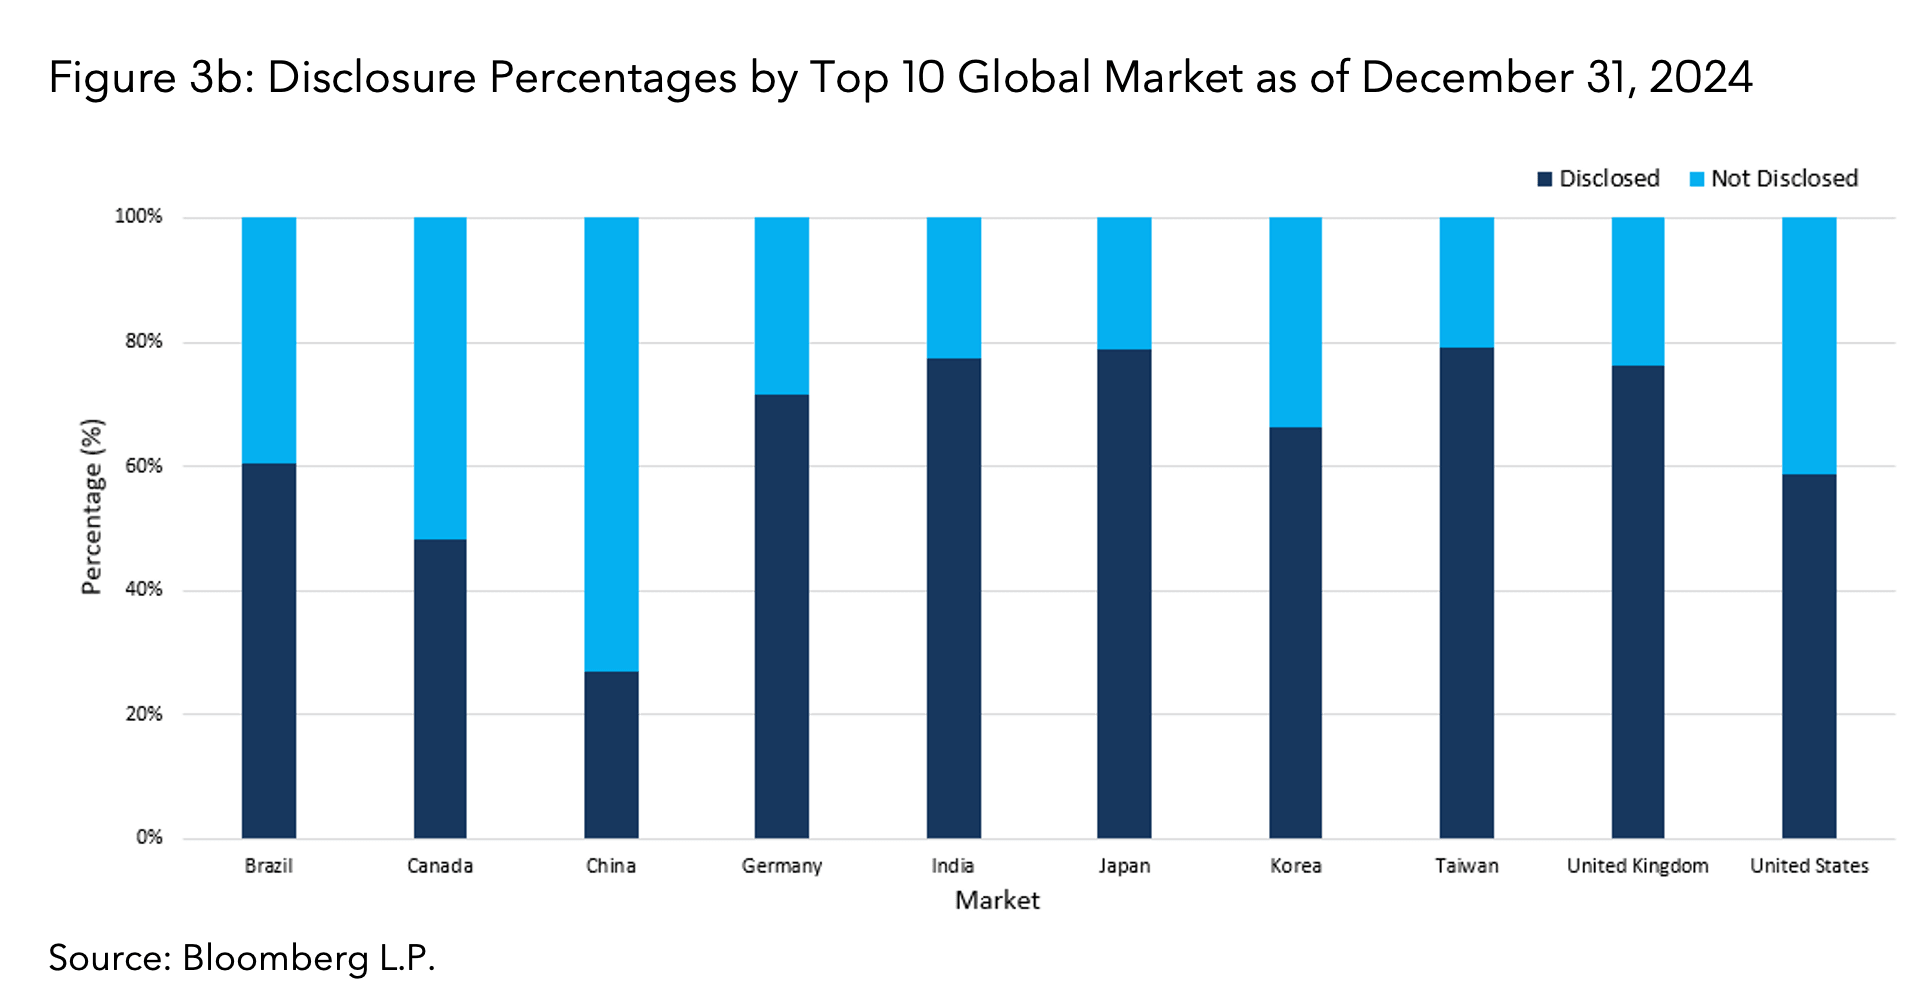
Disclosure rates for renewable energy use vary moderately across sectors and geographic markets. Figures 3a and 3b illustrate that most sectors disclose at rates between 50% and 80%, with Consumer Staples (74.5%), Consumer Discretionary (63.0%), and Communications (62.1%) leading. Geographically, developed markets generally exhibit strong disclosure rates, whereas certain emerging markets show significantly lower levels. While these variations introduce variability in data availability, the disclosure patterns do not indicate extreme biases toward specific sectors or regions, thereby providing a reasonably balanced dataset for subsequent analysis.
We conducted a sector-neutral analysis by sorting companies with available data on a quarterly basis into quintile portfolios based on renewable energy consumption, employing the following methodology:
- Sector-specific stock selection: Within each sector, companies were ranked and assigned to quintiles based on their percentage of renewable energy usage.
- Sector weight matching: Portfolios were rebalanced quarterly to match benchmark sector weights, eliminating sector-driven biases.
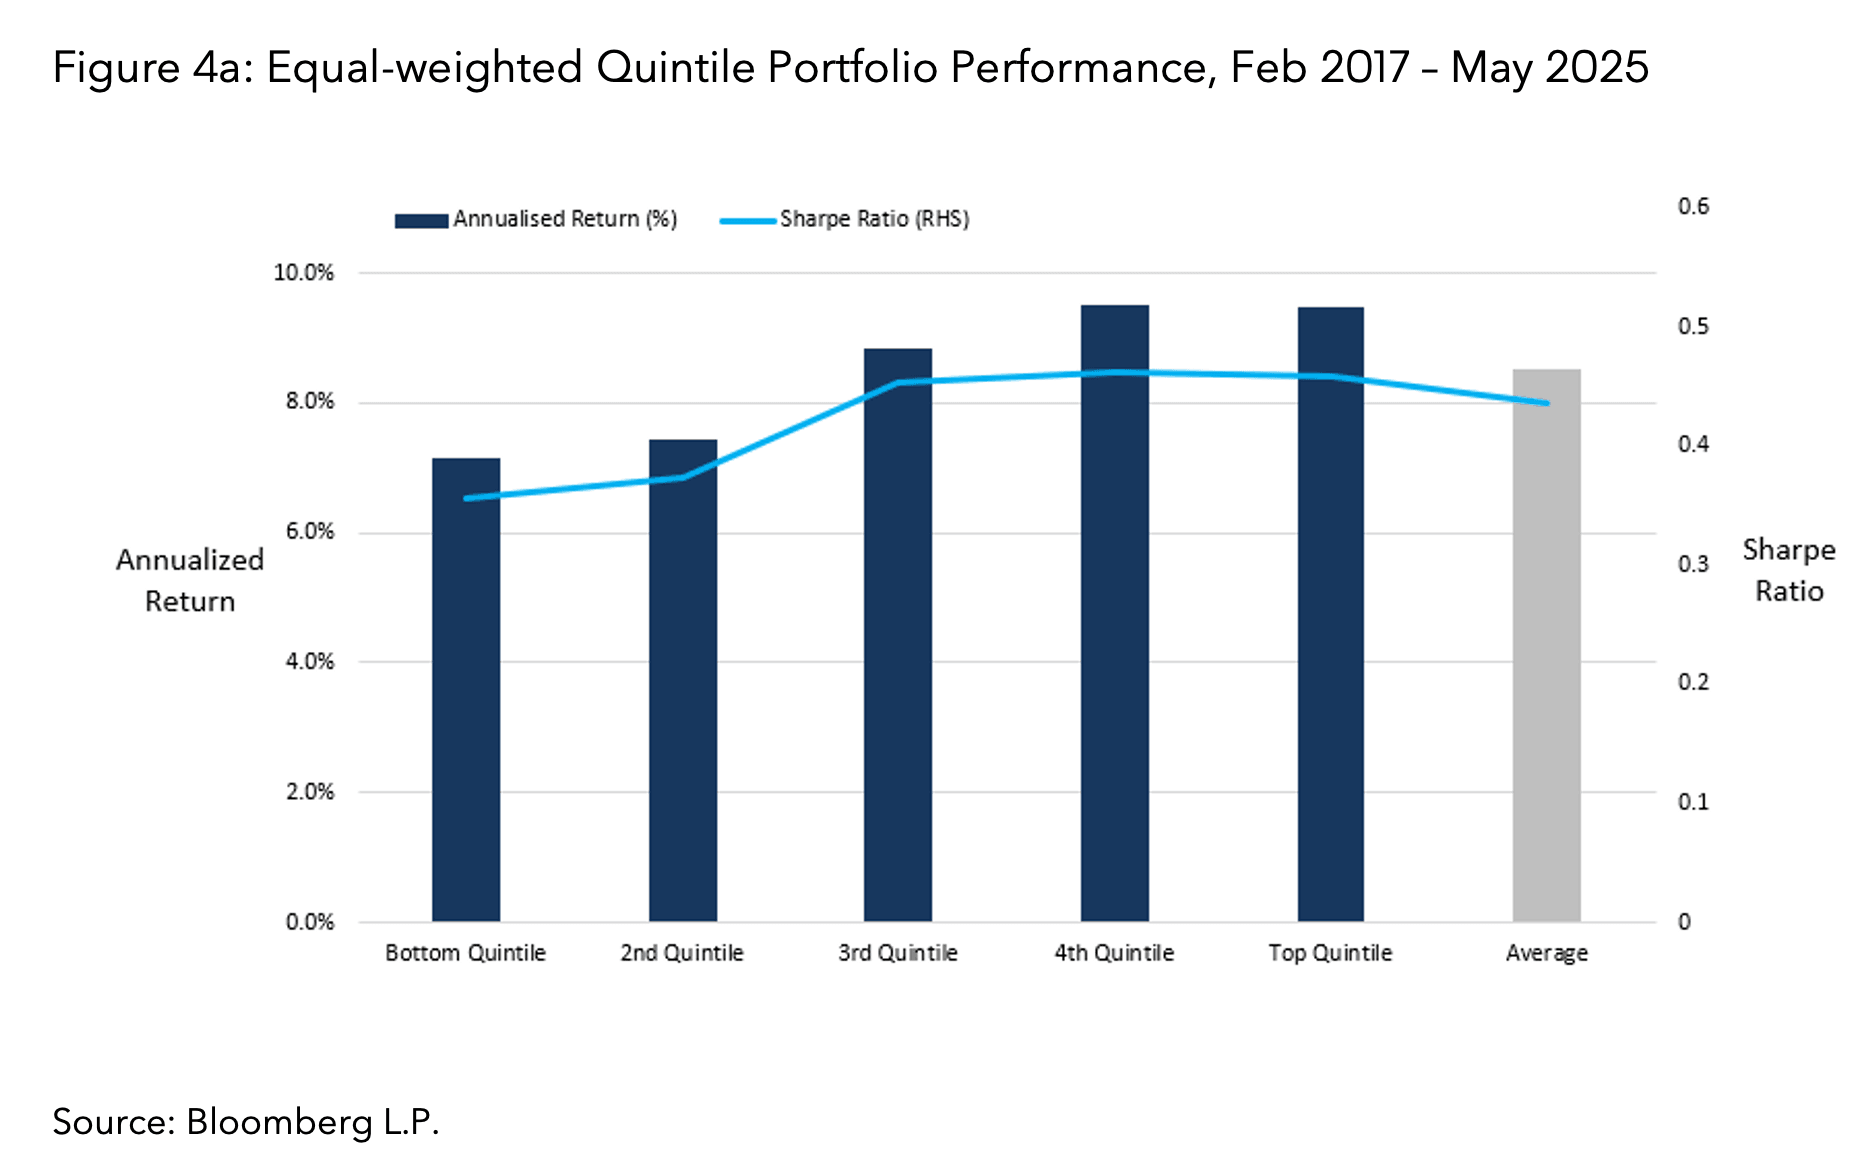
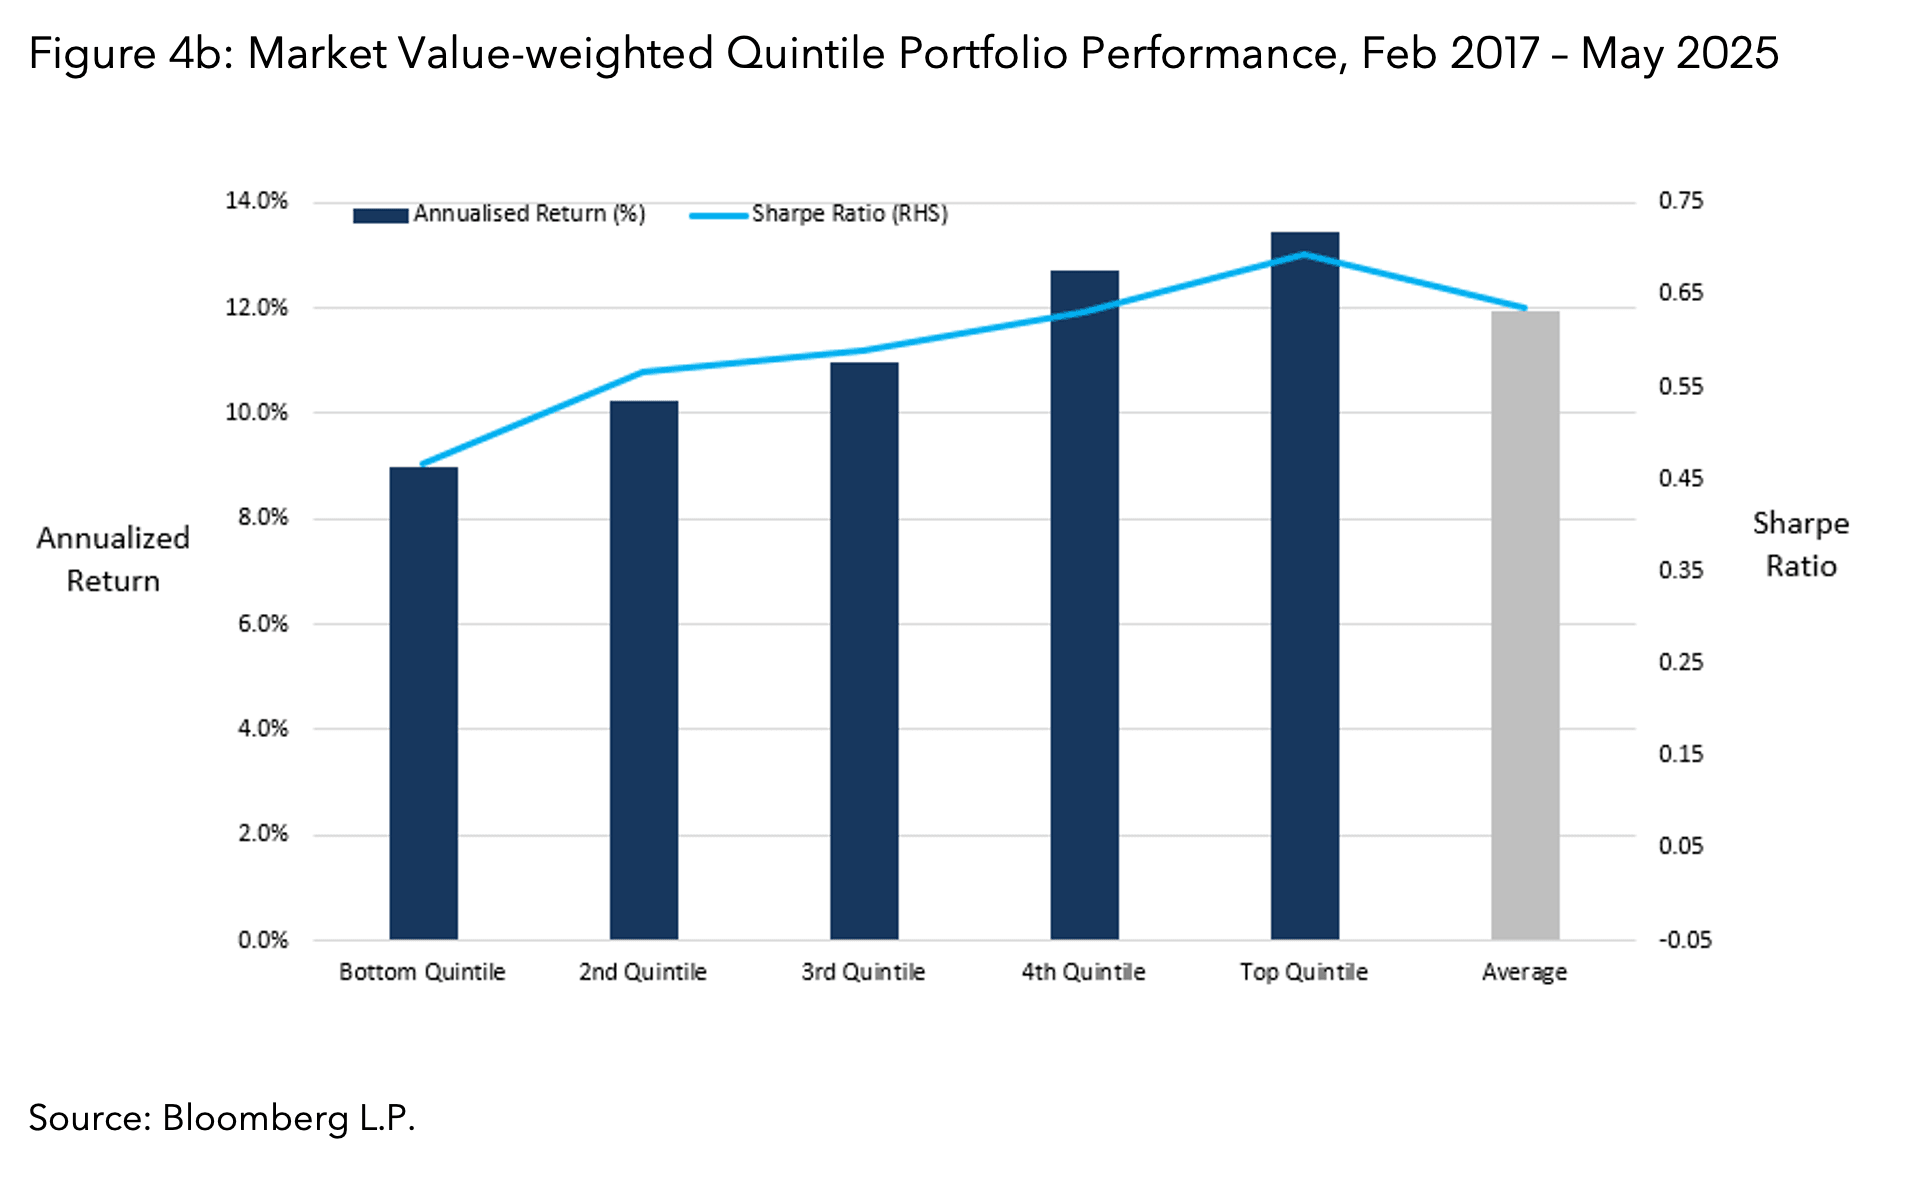
Figures 4a and 4b summarize performance outcomes for equal-weighted and market value-weighted quintile portfolios from February 2017 to May 2025.
Key findings
The analysis reveals a distinct pattern: companies in the highest quintile for renewable energy consumption achieved higher returns and superior Sharpe ratios (which measures risk-adjusted returns) compared to companies in the lowest quintile. Notably, this outcome persists across both equal-weighted and market value-weighted methodologies, indicating that performance differences are not driven purely by company size.
However, the observed outperformance did not reach conventional levels of statistical significance. This may be due to the limited historical period and moderate magnitude of the observed differences. Additionally, uneven disclosure rates and resulting data gaps could also have influenced these results.
To further investigate whether this observed outperformance can be specifically attributed to renewable energy consumption rather than incidental exposure to other factors, we conducted a return attribution analysis using Bloomberg’s Multi-Asset Class Fundamental risk model (MAC3) for equities. We formed equal-weighted long-short portfolios within the WORLD Index universe, going long the companies in the highest quintile and short those in the lowest quintile based on sector-specific levels of renewable energy consumption.
Note that this return attribution is based on monthly down-sampled risk exposures from MAC3, which are produced at a daily frequency. As a result, the attribution results shown here are approximations and may not precisely match analyses performed in PORT tool available via the Bloomberg Terminal.
A significant portion of the returns from these long-short portfolios could not be explained by conventional factors such as Industry, Country, Currency, or Equity Style (e.g., value, quality), termed the “selection effect”. In our analysis, this effect accounted for 1.0% out of the 2.4% annualized returns of the long-short portfolio, suggesting meaningful financial materiality linked explicitly to the level of renewable energy usage.
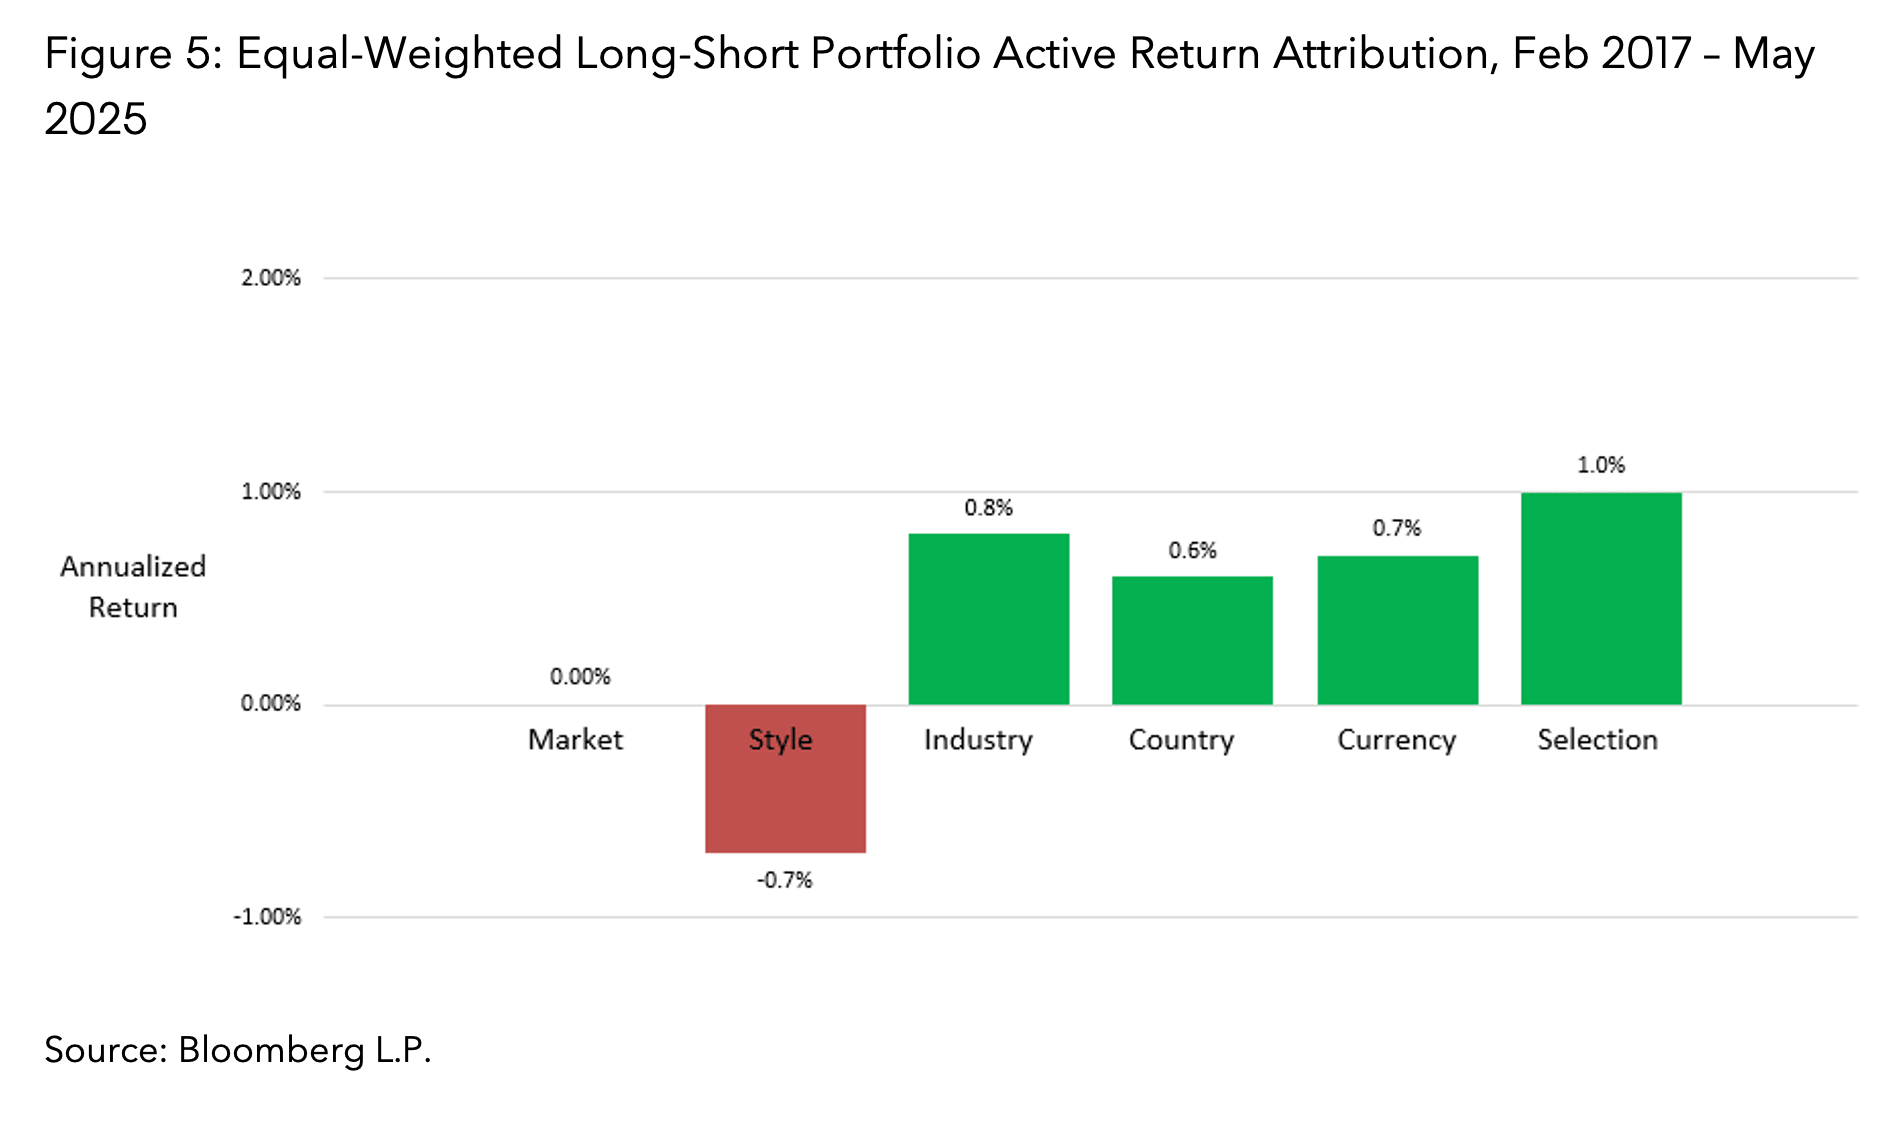
suggest financial benefits linked to greater renewable energy adoption, warranting further examination using extended timeframes and broader datasets for definitive validation. Investors, whether explicitly focused on energy transition or not, may therefore benefit from studying and incorporating this signal into their investment processes.
